

We all know that Looker is a super powerful platform for modeling and exploring your data. Data analysts love it because it lets them transform data on the fly, creating really powerful views in the process. If your goal is to mine data for interesting nuggets and distill complex data into actionable intel, then Looker is your platform (I sometimes refer to data analysts as data artists).
Once you’ve transformed, summarized, and otherwise sliced and diced your data, your next goal is to visualize it in the most meaningful way. It’s not surprising that visualizations are only as good as their underlying data. So the way you transform it, or rather the ease at which you transform it, is everything. Are you just showing the data as it’s organized in the underlying tables or are you taking a top-down approach by starting with the types of questions you are trying to answer?
And beyond that, if you wanted to show your data using a very creative visualization, do you have the means to transform your data to meet the unique requirements for that visualization (see the force-directed graph below). In this post, we will share three custom visualizations that we wrote for the Looker platform using the powerful D3 visualization library. While it’s true that many other platforms besides Looker offer a means to implement custom visualizations, these custom visualizations harness the power of Looker to make the visualizations comes to life.
1) Force-Directed Graph
Data is sometimes messy and unstructured, yet you want to find a way to visualize it. Often times you want to show complex relationships and interdependencies between entities. This is often true for language-processed data and social media as well as other types of organic data.
We used the d3-force module to create a force-directed graph using data from Looker. The force-directed graph shows a relationship between two points and the weight of the line indicates how strong that relationship is. From a data standpoint, the points and their colors (specified by a group) are dimensions and the weight of the line is a metric. This visualization is different from a tree because points can connect to other points in a many-to-many fashion, with the result potentially being a tangled ball of helpful insights.

This is really where the power of Looker comes into play. To create the visualization below, we need to specify relationships in a very specific way. In particular, this custom visualization requires each row to describe a connection between one entity and another. The first two dimensions are required to be the name and group of the first entity, respectively, and the second two dimensions must be the name and group of its connected entity. Finally, we needed a metric that indicates the weight of the line connecting them.
But this was not how our data was modeled in our database. In the example below using ride-sharing data in Boston from a company called Blue Bikes, we created a Looker derived table to transform the data into a summary format required for this visualization. Specifically, we created a derived table that grouped and ranked all rows in our facts table and kept a count of the number of trips between each of the destinations into a summary table. It took a few tries to get the data just how we wanted it, and it was simple to iterate over the code in the LookML to do so. To be clear, we didn’t need to talk with our data engineers to change ETL code or ask our database administrators to create a new view in our data warehouse to get this to work. A data analyst has all the tools they need to transform the data right in Looker to create this powerful visualization.
The result is really cool. You can interact with the force-directed graph, pulling the various dots around. They obey their own laws of physics, where the dots are either pulled towards each other, because there is a strong connection, or repelled outward as if lost. You can click on each dot to see what the entity is and explore your data visually. The colors of the dots are based on the group column where you can bucket your dots into helpful categories.
2) Bubble Chart
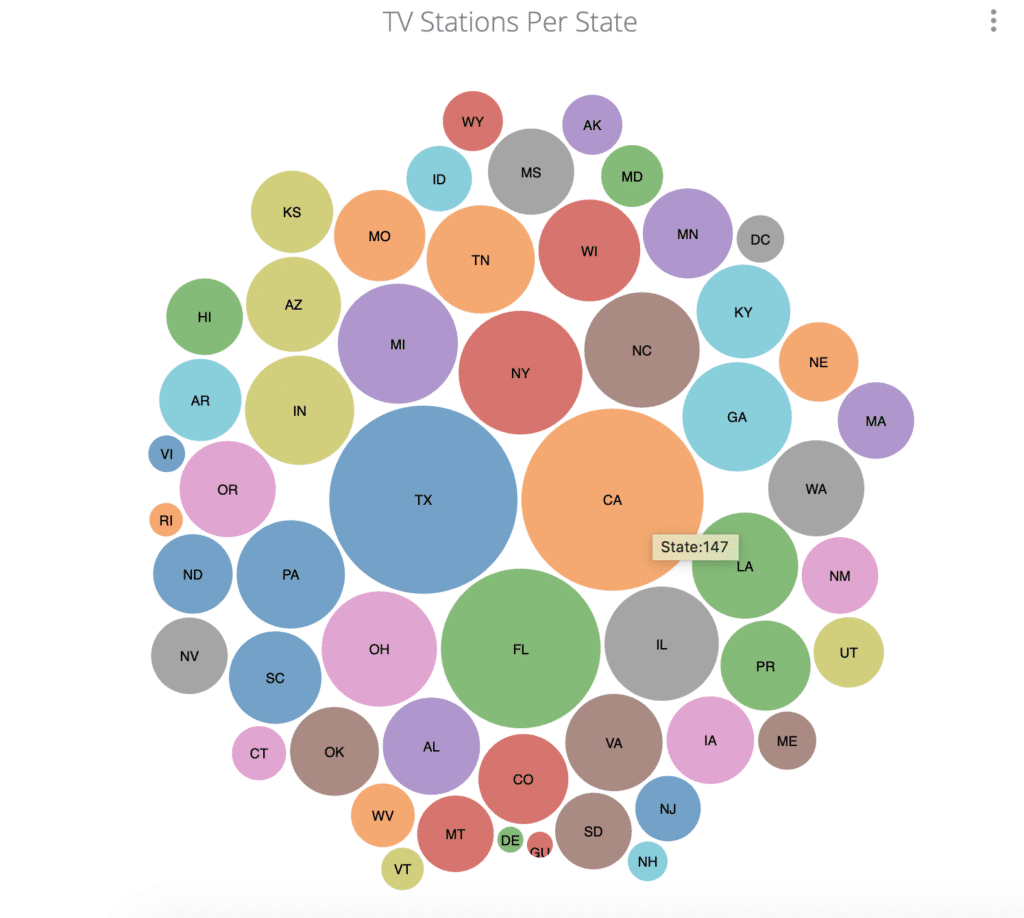
We created a custom bubble chart visualization for Looker using the d3.hierarchy module with circle packing. This is a simple, yet powerful, visualization for having circle size and color convey meaning for data. We also wanted to have text in the bubbles that could wrap and handle longer text fields.
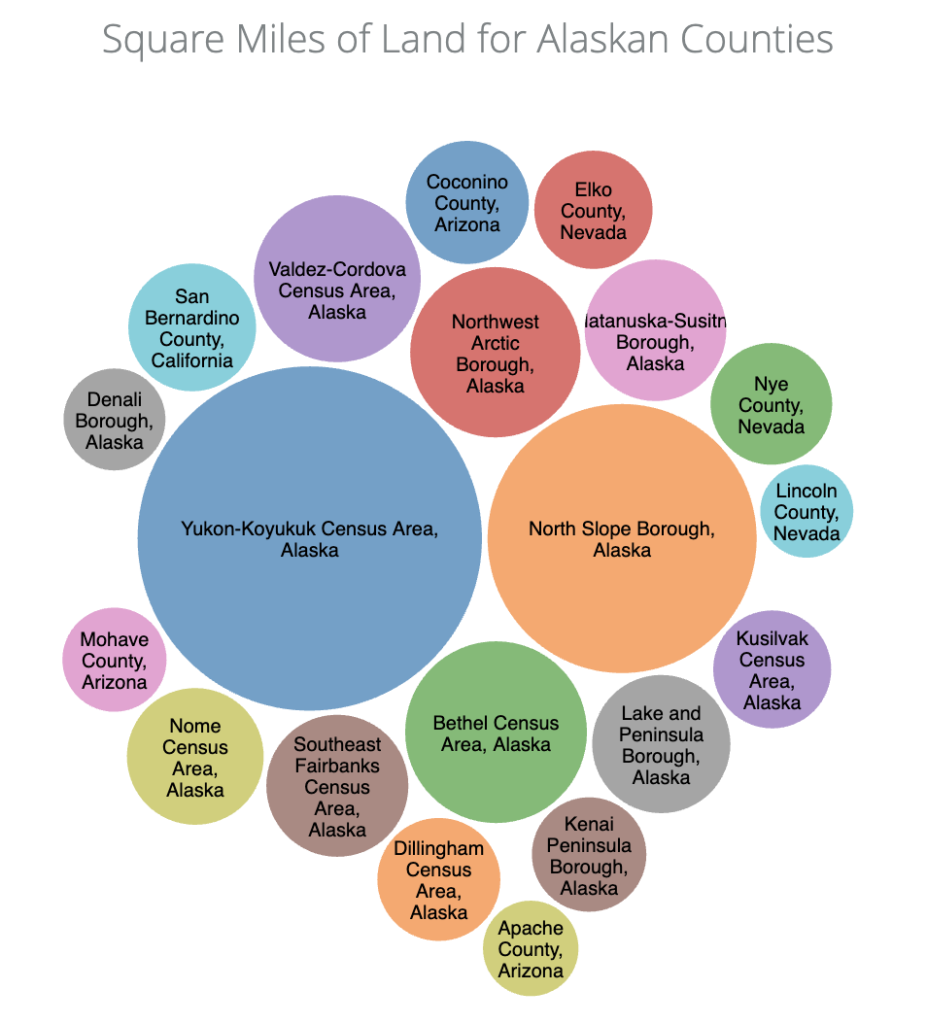
Using Looker, you create a dimension for the title of the circle as well as a single metric that will be used to determine the relative size of the circle compared to all of the circles. Optionally, you can specify additional dimensions that will used to group the bubbles by color.
We added a tooltip capability that shows you the value of the metric when you mouse over each bubble. In the example below, we are showing the number of TV stations per state. This type of visualization is especially useful when you have more rows than would be reasonable to show in a bar or pie chart but still want to display all of the data visually.
3) Scatterplot with Custom Tooltips
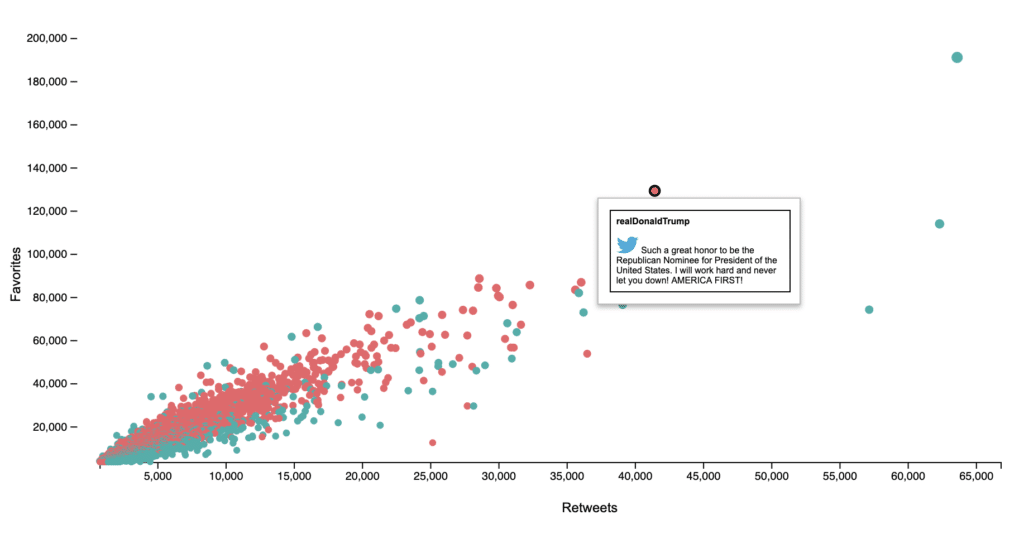
In this last example, we created a custom scatterplot visualization. While Looker has a built-in scatterplot visualization type, we wanted to push the limits of what’s possible with tooltips. Specifically, we wanted more flexible control over the labels of the scatterplot dots, we wanted a tooltip that could render HTML, and we wanted to be able to use the dots or tooltips as navigation to let you link to other dashboards or pages.
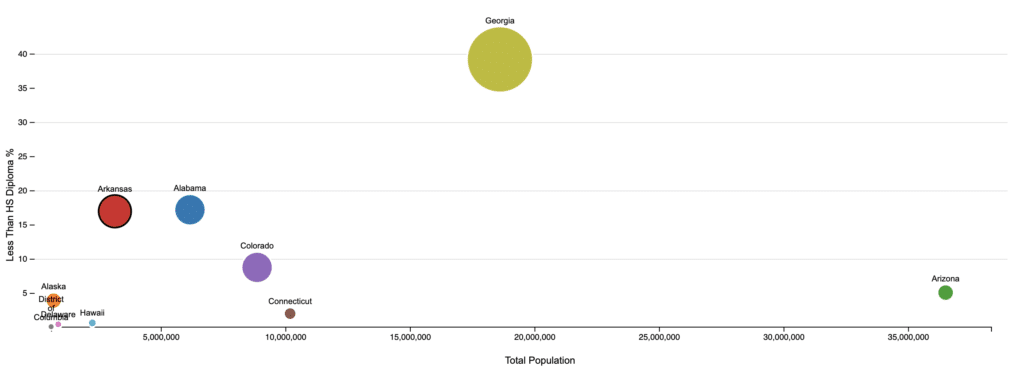
Dots – We added config options to specify the name of the dimension to use for the label, a dimension to use for the group (aka color), and a metric to use as the size. We borrowed some of the things we liked from the bubble chart above using circles but put them on an x-y coordinate system using d3 axis functions. The result is really cool dots with clear labels.
HTML Tooltips – We thought it would be neat if you could have the tooltip be anything you wanted, and the best way to do this was to allow HTML tooltips. Looker makes this really easy because they allow you to add html to your dimensions in LookML. In the example above, if we wanted the tooltip to show the image of the state flag when we moused over, we could simple display the HTML returned by the dimension as follows:
dimension: state_with_flag {
     type: string
     sql: ${TABLE}.State ;;
     html: <div style="font-size:10px; text-transform:capitalize;">{{value}}<br><img width=50 src="https://flag-images.com/us-states/images/flags/{{ value }}-small.png"><div>;;
 }
We added a configuration option to specify which dimension you want to display as a tooltip, and the result is this:
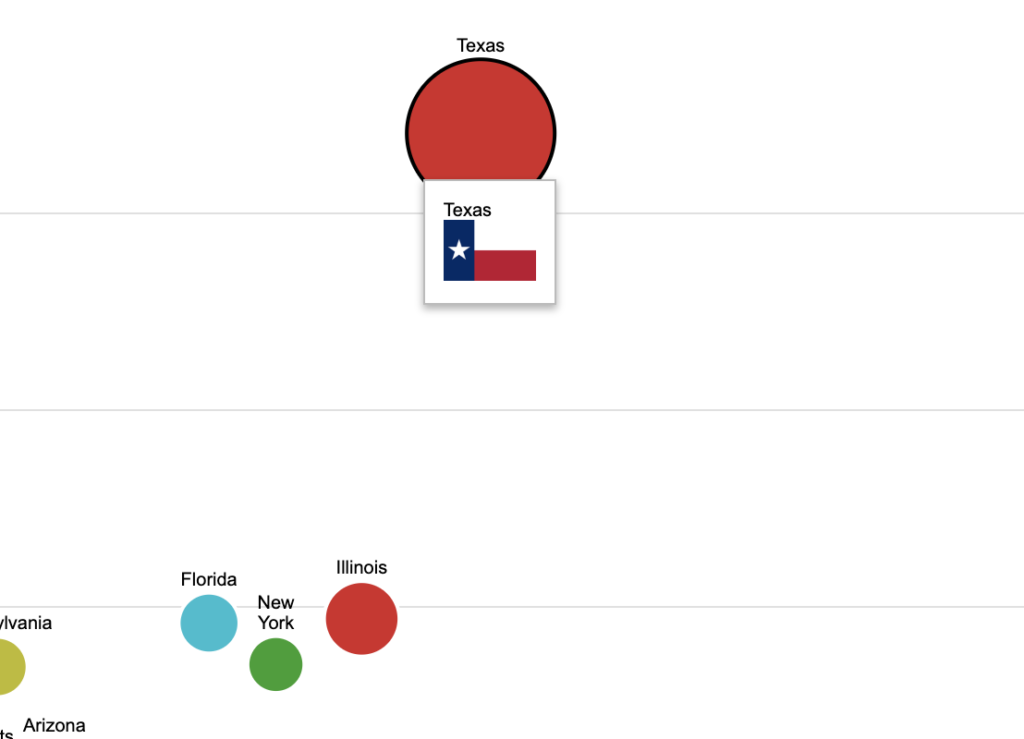
We can do some powerful things with this feature. For example, we charted all tweets related to the 2016 election based on the number of retweets and favorites. The tooltip is HTML generated in LookML which displays the tweet.
Links and Navigation – Looker custom visualizations are sandboxed iframes which makes it tricky to add navigation that changes the URL of the tab or window. Fortunately, we were able to design around this. First, Looker provides an interface for interacting with the parent iframe by using the LookerCharts.Utils.oenURL() function. This works well in the Looker UI but fails miserably when embedding (which is what a lot of our clients are doing.)
We created an option with our White Label Data product (a simple way to share your dashboards externally using your own brand without the consumers needing direct access to Looker) where the custom visualization updates the link within the iframe and then the application that embeds the iframe listens for Looker Javascript postMessage events that the URL has changed. After receiving that message, the White Label Data app redraws the entire page rather than having the contents of the iframe change.
Using these two capabilities, we allow either the dot to be clickable or for the tooltip itself to be clickage. You can use this to navigate to relevant pages or use it as a drilldown mechanism in an embedded application.
If you want more info on these custom visualizations or are interested in giving them a spin, feel free to contact us at hello@hashpath.com.