

Chartio is a cloud-based visualization tool for building charts and interactive dashboards. If you’ve used it before you know it’s a powerful tool with a drag-and-drop interactive mode as well as a SQL mode for making visualizations.
If you’ve built dashboards in Chartio before you may have felt like you were repeating your SQL logic behind all your charts, recreating the same pipeline steps, or trying to manage an ever growing WHERE clause. Trying to maintain a dashboard with complex code at the visualization level can get tedious. This is where the importance of the modeling layer comes in.
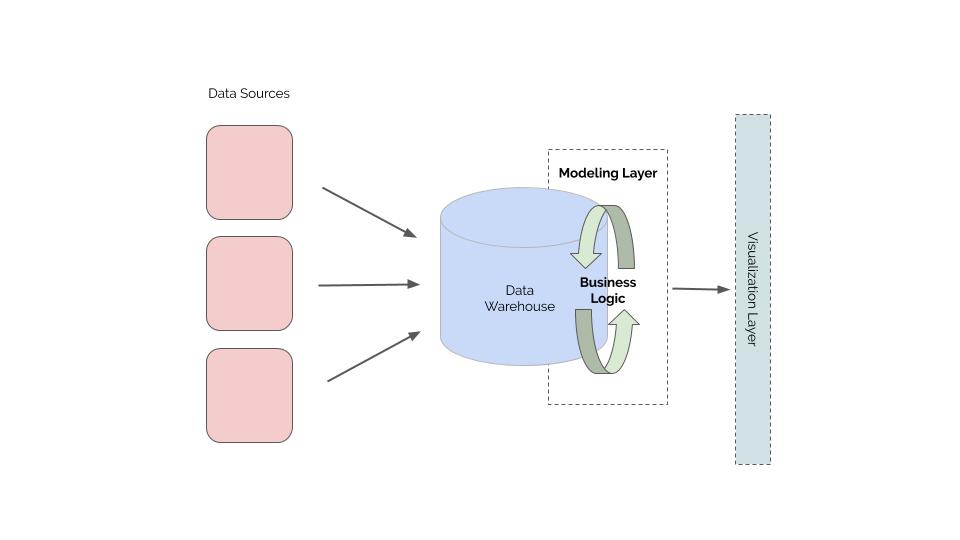
The modeling layer is critical for business intelligence project success and can be used to define and control key metric calculations. Without this layer most of the business logic ends up in the visualization layer, code gets repeated, and the dashboard becomes tedious to maintain. It can also help with query performance if summary tables are written back to the database.
All of these approaches take the “ELT” (Extract, Load, Transform) instead of the traditional ETL method. Below are four possible solutions help with this maintainability.
Use a Transformation Tool
Create jobs and transformations in your tool of choice. Using one of these tools eases the maintainability of your logic and simplifies the visualization layer in Chartio. These tools use SQL transformations to allow you to get your data into the shape you want before getting to Chartio. They also let you abstract your business logic out of the visualization layer, so other tools and queries can share the same logic.
Matillion – A powerful data transformation tool for cloud warehouses. If you have very large datasets this is the best tool for the job. It is best for data analysts who are also data engineers as it can be quite technical to configure and set up. It’s priced by the hour and not by the row, as many other ELT/ETL tools are. That makes it a cost effective solution when you have a lot of data.
dbt – A command line transformation tool created by analysts and for analysts. dbt lets you create tables and views in your warehouse simply by writing SELECT statements. You only need to know SQL, dbt will take care of the rest.
Fivetran transformations – If you have data coming from multiple sources Fivetran is a great choice. Easily create SQL-based transformations in the data warehouse, set conditions and events to run transformations, and set up a schedule to automatically update tables whenever new data is loaded into the warehouse.
Create a Database View
Don’t feel like you need a separate tool for managing your data transforms? In that case a database view (or several) is a great choice. Views are virtual tables that can be queried just like regular database tables. If performance is a concern then these views can be materialized (written back to the database) but the trade off is that data will not be real-time and will have to be refreshed.
Using database views with Chartio will simplify the code in your visualizations. All the complicated joins, intricate WHERE clauses, or aggregated data tables can live in the data views allowing your dashboards to be simple and maintainable.
Chartio Custom Schema
Chartio has a feature called Custom Schema. This feature can be used to make a custom column that already formatted or aggregated before you get to the data analysis. You can also make a custom table that can limit the joins you have to make in your visualizations. One limitation of this feature is that it can’t be used in SQL mode, only drag-and-drop.
Chartio Data Store
Don’t have access to create views in your database? Aren’t using a transformation tool? A Chartio data store is another great solution to create maintainability in your dashboards. And you only have to know SQL!
There is refresh limit on data stores which means your data won’t be real time. But they can be refreshed as frequently as hourly which might be enough for your needs. There is also a row limit of a million rows built into the queries so this is not a good solution if you have a large amount of data.
That being said Chartio Data Stores are simple to set up and simple to update. You can also create separate permissions for each data store adding another layer of security to your data while keeping the ease of maintainability. Read more about how to set these up in Chartio’s documentation.
If you need any help with Chartio data modeling, we’re here to help. Shoot us a note at hello@hashpath.com.